Mapping & Validation · Islandwide
Temperature & Humidity Mapping in Singapore
Temperature mapping, also called thermal mapping, profiles an entire warehouse, cold room or controlled space using a grid of calibrated data loggers, so you can qualify it for storing pharmaceuticals, biologics and medical devices. Whether your auditor asks for warehouse mapping, warehouse temperature mapping or a cold room study, Unitest maps and documents your real conditions to WHO TRS 961 Annex 9, HSA GDP and GMP protocol, with loggers carrying SAC-SINGLAS-accredited traceability under schedule LA-2023-0845-C.
- Audit-ready report. Hot/cold-spot analysis, pass-fail vs your criteria
- Accredited loggers. SAC-SINGLAS-traceable · LA-2023-0845-C
- On-site, islandwide. Mapped at your facility, minimal disruption
- Fast turnaround. 5–7 working days standard · 2–3 days express
Request a mapping quote
Tell us about your space and we'll come back with a clear, itemised quote, usually within one business day.
Executed to recognised standards
ISO/IEC 17025
Every logger calibrated under our accredited system
WHO TRS 961 Annex 9
Recognised storage-area mapping protocol
HSA GDP · GUIDE-MQA-013
Singapore GDP for medicinal products (Dec 2023)
IEC 60068-3-5 / -11
Thermal-chamber performance confirmation
GDPMDS · GN-33
Medical-device distribution, Singapore
The mapping study is a documented service written to the standards above. Only the loggers' traceability is accredited: each is calibrated under our SAC-SINGLAS accreditation (LA-2023-0845-C, ISO/IEC 17025). We never present the study itself as an accredited test.
What it is
What is temperature mapping (thermal mapping)?
It measures how temperature and humidity actually vary across a controlled space, not just at one convenient point.
Temperature and humidity mapping, often called thermal mapping, profiles a warehouse, cold room, chamber or storage area using a grid of calibrated data loggers recorded over a representative period. It reveals hot spots, cold spots and humidity variation across the whole space, so you can qualify it for its intended use and document that it holds the conditions your products and regulators require.
This is different from instrument or chamber calibration. Calibration verifies one piece of equipment, while mapping qualifies the environment. Environmental qualification is exactly what cold-chain, HSA GDP and GMP requirements ask for when sensitive goods are stored or moved through a space.
To keep the honest line clear: the mapping study is a documented service, not an accredited test. What is accredited is the traceability of the loggers. We calibrate every sensor with SAC-SINGLAS-accredited traceability under our schedule LA-2023-0845-C, then run the study to recognised protocol. If you run your own loggers between studies, our temperature data logger calibration in Singapore service keeps them traceable. For more background, read our guide on what temperature mapping is.
What we map
Warehouse mapping, cold rooms and every controlled space
From deep-freeze cold rooms to dry rooms and stability chambers, with temperature and humidity profiled together, within our accredited envelope of −80 °C to +1000 °C and 5 to 90 %RH.
Freezers, fridges & cold rooms
Cold-chain storage down to −80 °C
Ovens & furnaces
Heat-treatment and curing enclosures
Warehouses & ambient stores
Pallet racking, staging and dispatch
Sterilisers & autoclaves
121–134 °C moist-heat cycles
Stability & climatic chambers
e.g. 25 °C/60 %RH, 40 °C/75 %RH
Incubators
30–37 °C controlled culture spaces
Lyophilisers (freeze dryers)
Shelf-temperature distribution studies
Reefers & cold-chain vehicles
Transport qualification, on request
Only sensitive to temperature? We scope the protocol to temperature alone. In most Singapore warehouses, where ambient humidity is frequently above 75%, mapping both parameters together is the safer choice.
What's included
What every mapping study includes
A clear, fixed scope so you know exactly what you're getting before you approve a quote.
Ranges reflect Unitest's accredited traceability scope under LA-2023-0845-C. The mapping study itself is a documented service written to the standards above, not an accredited test.
Why it matters
Why map your temperature & humidity
Insight into your real conditions
Hot, humid spaces carry genuine product and occupational-health risk. Mapping gives you precise, position-by-position insight into how temperature and humidity actually behave inside your controlled areas, which is exactly what you need to qualify a space for its intended use.
Decisions backed by evidence
Accurate records of how a space performs over a representative period let you act on measured facts, not assumptions. You optimise how the space is loaded and used, and you produce the documentation that HSA GDP (GUIDE-MQA-013), GMP and your customers' audits expect.
Traceable, defensible results
Every logger we deploy is calibrated with SAC-SINGLAS-accredited traceability under our schedule LA-2023-0845-C. The study is run to a written protocol, so the resulting report stands up to auditors, qualified persons and regulators.
The Singapore factor
Why Singapore's humidity is the real storage risk
An honest local point most mapping providers skip: in this climate, humidity is often the parameter that fails first.
Singapore rarely drops below 75% RH
Singapore's tropical climate keeps ambient relative humidity high year-round, frequently above 75% and often higher after rain. A warehouse that feels comfortable can still sit well outside the humidity band that moisture-sensitive goods require.
Humidity is a storage risk, not a comfort issue
Sustained high humidity degrades tablets, capsules, biologics, diagnostic kits, electronics and packaging. Without mapping you are guessing whether every corner of your store stays inside specification, and the corners are usually where it fails.
Mapping proves the humidity band, not just the temperature
Temperature-only studies miss half the picture in Singapore. Mapping both parameters together shows where humidity pools near doors, walls, dock levellers and dead zones, so you can fix it before a batch or an audit finds it for you.
If your storage risk is temperature alone, we scope the protocol accordingly: the same team, the same standards, just fewer parameters. In most Singapore warehouses and cold rooms, mapping both together is the safer choice.
What you're paying for
Why a defensible mapping study costs more than a quick check
Named standards, not shortcuts
The study is executed to WHO TRS 961 Annex 9 and its Supplement 8, aligned with HSA GDP GUIDE-MQA-013. That documented depth, not a quick walk-through with a handheld thermometer, is what an auditor actually checks.
Accredited traceability, stated uncertainty
Every logger we deploy is calibrated under our SAC-SINGLAS accreditation LA-2023-0845-C, with stated uncertainty. Readings near your limits come back clearly pass or clearly fail, instead of disputed.
The cost asymmetry
A cheaper study can look like the saving on the day. If it misses a hot, cold or humid spot, the real bill is the batch write-off, the re-qualification and the audit finding, not the price difference between quotes.
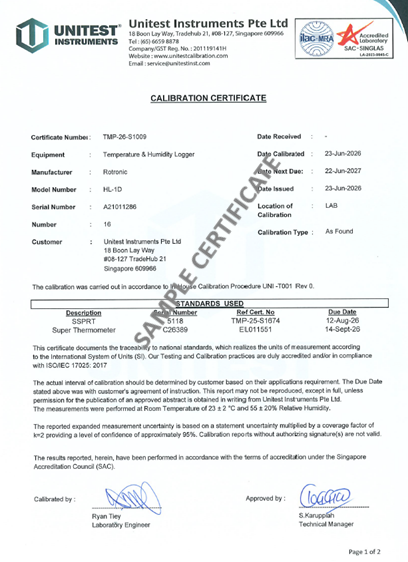
The logger calibration certificates supplied with your mapping report.
If price is the only criterion, there are cheaper providers. If you have to stand behind the results in an audit, this is where the difference is earned.
How it works
Our mapping process
Site survey & protocol
We assess the space and agree the mapping protocol with you: the number and grid placement of sensors, logging duration, seasonal or load conditions to capture, whether to record temperature alone or temperature and humidity together, and the acceptance criteria the space must meet.
Sensor placement & logging
Calibrated data loggers are positioned in a three-dimensional grid, including likely hot and cold spots, and record temperature (and humidity, where scoped) continuously over a representative period.
Data analysis
We analyse the full dataset, identify hot spots, cold spots, humidity pooling and variation over time, and compare every logger against your acceptance criteria.
Reporting
You receive a documented mapping report with the sensor layout, the raw and summarised data, a pass or fail assessment against criteria, and the traceability of every logger used.
Recommendations
Where a zone falls outside specification, we flag it and recommend practical corrective actions: airflow changes, exclusion zones, added monitoring points or equipment adjustments.
Re-verification (optional)
After corrective actions, or on your qualification cycle, we can re-map to confirm the space now holds the conditions your products and regulators require.
Sensor count and placement follow recognised guidance, including WHO TRS 961 Annex 9 and its Supplement 8 on temperature mapping of storage areas, with chamber work aligned to the performance-confirmation methods of IEC 60068-3-5 and IEC 60068-3-11. For the detail, see our field notes on temperature mapping sensor placement and our guide to temperature mapping for HSA GDP compliance.
What you get
Your mapping deliverables
Everything an auditor, a qualified person or a customer needs to see that the space is fit for purpose.
Mapping study report
A complete, audit-ready report documenting the protocol, method, dataset, results and conclusions for the mapped space.
Hot and cold-spot analysis
Clear identification of the warmest, coldest and most humid positions in the space, with the data that supports each finding.
Sensor layout & placement record
The exact grid positions of every logger, so the study is repeatable and defensible for future qualification cycles.
Acceptance-criteria assessment
A pass or fail evaluation of every measurement position against the temperature and humidity limits agreed for your goods.
Logger traceability
Calibration traceability for each data logger, calibrated with SAC-SINGLAS-accredited traceability under our schedule LA-2023-0845-C.
Recommendations & actions
Practical, prioritised recommendations for any out-of-specification zone, so you know what to fix and where.
Who we map for
Industries we map for
Any operation that stores or moves temperature- and humidity-sensitive goods in Singapore.
Pharmaceuticals
Qualify warehouses and cold rooms for storing and distributing medicines to HSA GDP and GMP expectations.
Biologics & vaccines
Prove that cold-chain storage holds tight temperature and humidity bands for temperature-sensitive biological products.
Medical devices & diagnostics
Document controlled storage conditions for devices, reagents and diagnostic kits that degrade outside specification, aligned with the GDPMDS (GN-33) expectations for medical-device distribution in Singapore.
Food & beverage
Verify chillers, freezers and ambient stores for food safety and shelf-life protection, supporting SFA licensing conditions and HACCP-based cold-chain controls.
Logistics & 3PL
Give your pharma, healthcare and F&B clients the qualified, mapped storage and documentation their own audits demand.
Need your own loggers checked rather than a whole space mapped? See our data logger calibration in Singapore page. Need a single chamber or freezer calibrated instead? See our chamber & freezer calibration, humidity calibration and temperature calibration services, all delivered under our SAC-SINGLAS accreditation.
Get started
Get a documented, audit-ready mapping quote
Send us the space you need qualified: type, approximate size and target band. We'll recommend the sensor count and protocol, and return a clear, itemised quote you can put in front of your quality team.
Questions
Mapping FAQ
How much does temperature and humidity mapping cost?
Pricing is quote-based, driven by the size of your space, the number of sensors required and the protocol duration. Send us your space details and we'll return a clear, itemised quote, typically within a short turnaround. Free collection and delivery for instrument calibration orders of S$300 and above also applies when logger calibration is bundled with the study.
How long does a mapping study take?
It depends on the size of the space and your protocol. Logging typically runs over a representative period: per WHO guidance, often 24 to 72 hours for a cold room and around 7 days for an ambient warehouse to capture a full working week, and sometimes longer for a full qualification or to capture seasonal and load conditions. Separately, our standard logger calibration service runs 5 to 7 working days, with a 2 to 3 working day express option on request; the mapping report follows once the agreed protocol and logging period are complete. We confirm the duration and sensor count with you when we agree the protocol.
Can you do it on-site? Where is your lab?
Yes, mapping is performed on-site at your facility, islandwide. Our laboratory is at Tradehub 21, 18 Boon Lay Way, Singapore.
Is your temperature and humidity mapping SAC-SINGLAS accredited?
The mapping study is a documented service, not an accredited test. What is accredited is the traceability of the measurement chain: every data logger we deploy is calibrated with SAC-SINGLAS-accredited traceability under our schedule LA-2023-0845-C, and the study is executed to WHO TRS 961 Annex 9, HSA GDP and GMP protocol. That gives you accredited traceability of the sensors plus a defensible, standards-based study.
Is it traceable to NIST?
Our data loggers are calibrated under SAC-SINGLAS accreditation (ISO/IEC 17025). SAC is a signatory to the ILAC Mutual Recognition Arrangement, so accredited results are internationally recognised, including in markets that specify NIST-traceable requirements. We do not claim direct NIST traceability.
Will the SINGLAS logo appear on the report?
The SAC-SINGLAS mark appears on the accredited logger calibration certificates supplied with your study. The mapping report itself is a documented service report, since mapping is not an accredited activity on our schedule. That is the honest position, and it is the one an auditor will respect.
Do you provide as-found and as-left data?
Yes, across two documents. The calibration certificates for the data loggers carry as-found and as-left data. The mapping report carries the sensor layout, the raw and summarised data, hot and cold-spot analysis, and a pass or fail assessment for the space.
What is temperature and humidity mapping used for?
Mapping qualifies warehouses, cold rooms, chambers and storage areas for storing, processing and distributing temperature- and humidity-sensitive goods such as pharmaceuticals, biologics, medical devices and food. It produces the documented evidence needed to demonstrate the space holds the conditions your products and regulators require.
Why does Singapore's climate make humidity mapping important?
Singapore's tropical climate keeps ambient relative humidity high all year, frequently above 75%. Sustained high humidity degrades tablets, biologics, diagnostics, electronics and packaging, and it tends to pool in specific zones such as near doors and dock areas. Mapping proves where those zones are so you can control them before a batch or an audit is affected.
Is temperature mapping the same as chamber or freezer calibration?
No. Chamber and freezer calibration verifies a single piece of equipment, while temperature and humidity mapping profiles an entire space using a grid of loggers to qualify it for use. They are different services and are often done together. See our chamber and freezer calibration service for single-equipment work.
Is thermal mapping the same as temperature mapping and warehouse mapping?
Yes. Thermal mapping and temperature mapping are two names for the same study: a grid of calibrated data loggers records conditions across a space over a representative period. Warehouse mapping, or warehouse temperature mapping, is that same study carried out in a warehouse or ambient store, typically logged for around 7 days to capture a full working week. We use the same protocol, the same standards and the same loggers, calibrated with SAC-SINGLAS-accredited traceability, whichever term your auditor or customer uses.
How many sensors do I need for my warehouse?
Sensor count depends on the volume and layout of the space, the number of levels, and the risk profile of your goods. As typical guidance, a small chamber uses a minimum of around 9 loggers, a walk-in cold room around 9 to 15, and a large warehouse from about 20 upward. We follow recognised guidance and place loggers in a three-dimensional grid that captures likely hot and cold spots. We agree the exact number with you during the protocol stage, so the study is both thorough and proportionate.
Do you map temperature only, or humidity as well?
We can do either. In Singapore we usually recommend mapping both temperature and humidity together, because high ambient humidity is a real storage risk here. If you only need temperature, we scope the protocol to record temperature alone; if you need the full picture, we run both parameters in the same study.
Can you repair or adjust instruments too?
Yes. Our test and repair service handles complex, complicated and unique adjustment cases, so a faulty logger or instrument can be diagnosed, repaired and re-calibrated before it goes back into service.
What do I receive at the end of the study?
A documented mapping report: the protocol and method, the sensor layout, the raw and summarised data, a hot and cold-spot analysis, a pass or fail assessment against your acceptance criteria, the traceability of every logger used, and practical recommendations for any out-of-specification zone.